Detect sustained HIGH or LOW GPU usage while filtering short spikes.
Linux GPU Monitoring
GPUAlert Enterprise
Monitor NVIDIA and AMD GPU utilization, VRAM, temperature, power, hardware health and active GPU processes with one lightweight offline agent.
NVIDIA + AMD Offline License Email + SMS + Chat Prometheus ReadyDownload Trial License Pricing How to Run
Built for private GPU servers
- No cloud monitoring account required
- No telemetry sent to Smartbooth
- Automatic GPU vendor detection
- Consecutive-check and recovery alerts
- Works in hosts and containers
One agent, both GPU vendors
See the GPU condition that needs attention
Watch temperature, power limits, NVIDIA XID/ECC and AMD RAS indicators.
Report PID, user, command, VRAM and container-aware process context.
GPU and host monitoring
- Per-GPU utilization and VRAM usage
- Consecutive VRAM HIGH alert and recovery
- Temperature and power draw
- GPU missing or driver failure detection
- Host memory HIGH and LOW monitoring
- TOP1–TOP5 memory process reporting
- Alert recovery and repeat control
Direct notification channels
- Email and IamAlive email
- Smartbooth SMS and email delivery
- Telegram and Microsoft Teams
- Slack, Discord and LINE
- Generic JSON webhook
- PagerDuty Events API v2
Understand the status
What HEALTH OK actually confirms
HEALTH OK means GPUAlert detected no fault in the telemetry currently available from the GPU, driver and operating system. It is not a complete hardware self-test. GPU utilization HIGH/LOW, VRAM HIGH and host memory alerts are evaluated separately.
| Health check | NVIDIA | AMD |
|---|---|---|
| Configured temperature threshold | Checked | Checked when hwmon data is available |
| Configured percentage of the GPU power limit | Checked | Checked when hwmon power/cap data is available |
| Uncorrected ECC errors | Checked on ECC-capable devices | Covered by available RAS counters |
| Hardware, thermal, power-brake and software-thermal slowdown | Checked | No separate slowdown telemetry check |
| New NVRM Xid driver errors | Checked when dmesg is readable | Not applicable |
| UMC, GFX, SDMA, MMHUB, PCIe BIF and XGMI WAFL RAS errors | Not applicable | Checked when exposed by the driver |
Unavailable telemetry is not treated as a fault. For example, a consumer NVIDIA GPU may not provide ECC counters and a container may deny access to dmesg. The current status should therefore be read as no fault detected in available telemetry. This release displays HEALTH OK or HEALTH FAULT; a separate HEALTH PARTIAL state is not yet implemented.
Normal NVIDIA idle or application-clock limiting is treated as power saving. A missing GPU or unavailable driver uses the separate GPU MISSING alert.
Fault details are included in the alert
A health fault identifies the affected GPU and includes every detected reason. Multiple reasons are separated with semicolons:
GPU HARDWARE HEALTH ALERT
Vendor: NVIDIA
Fault GPUs: 1
GPU0 [NVIDIA] Example GPU: TEMP 95 C, POWER 168/170 W,
HEALTH FAULT (temperature 95 C >= 90 C;
power 168/170 W >= 98% limit;
hardware or thermal clock slowdown)
Trial alerts contain the same details with a [TRIAL MODE] prefix. Licensed alerts omit the prefix. When the fault clears, GPUAlert sends a matching health recovery notification.
Verified on a real NVIDIA GPU
RTX 3060 live-load validation
GPUAlert was compiled with GCC warnings enabled and tested against an NVIDIA GeForce RTX 3060 under both idle and 100% CUDA load.
| Test | Result |
|---|---|
| Automatic vendor and device discovery | Passed — NVIDIA GeForce RTX 3060 |
| Utilization, VRAM, temperature and power | Passed at idle and 100% load |
| Container-aware GPU process attribution | Passed — PID, user and command resolved |
| JSON status, Prometheus metrics and health endpoint | Passed |
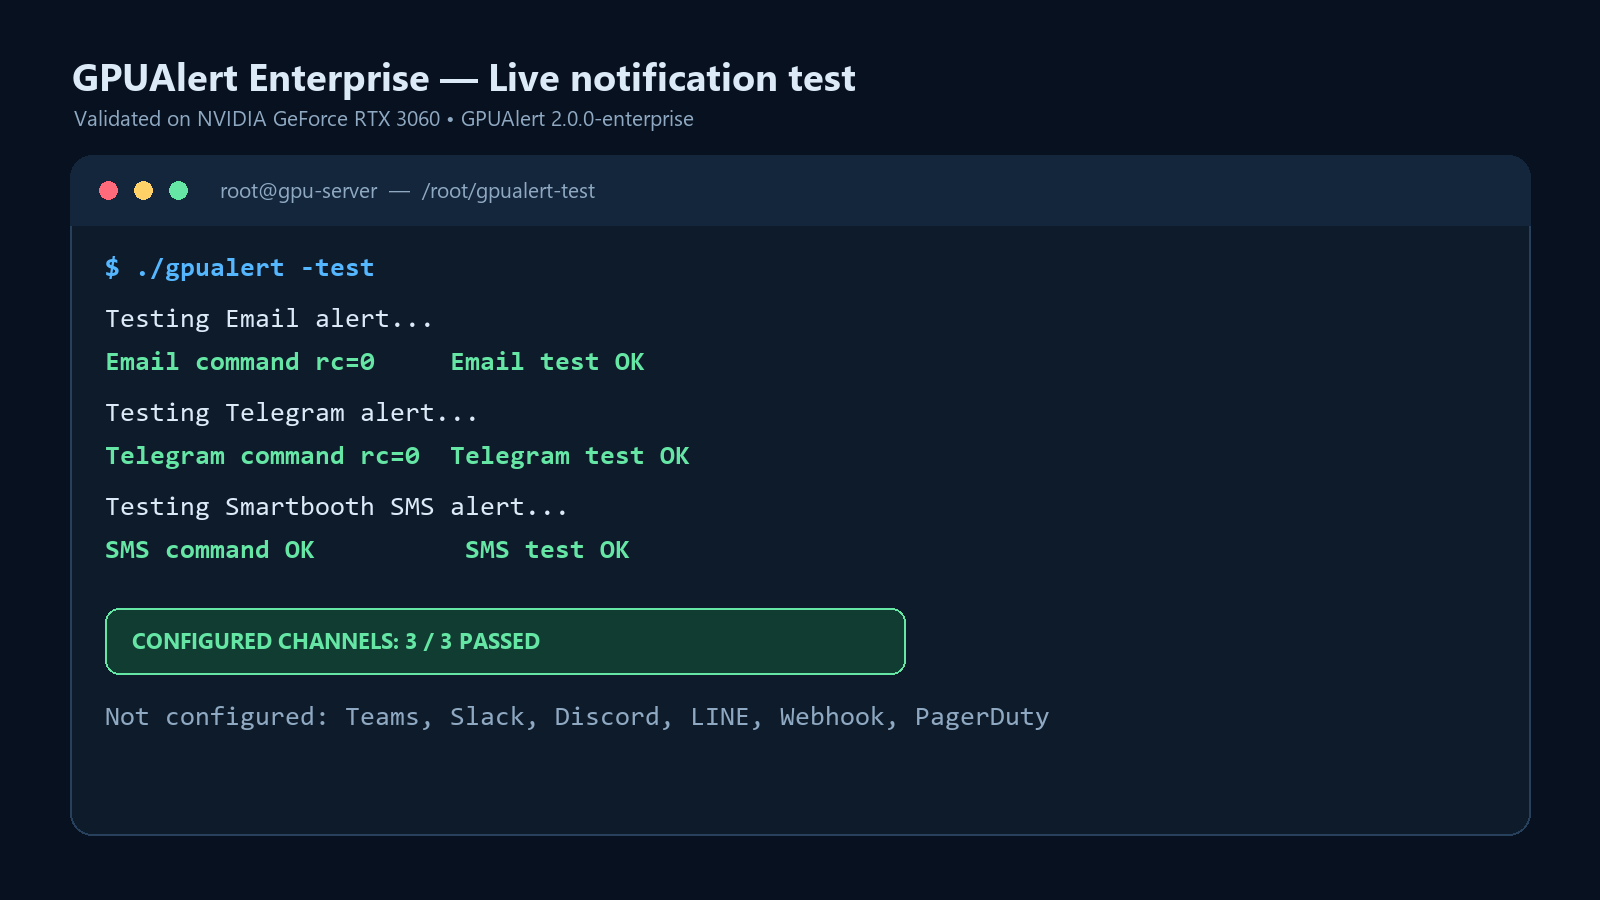
| Email, Telegram and Smartbooth SMS | 3 of 3 configured channels passed |
HEALTH OK — normal NVIDIA idle clock throttling is recognized as power saving, not a hardware fault.
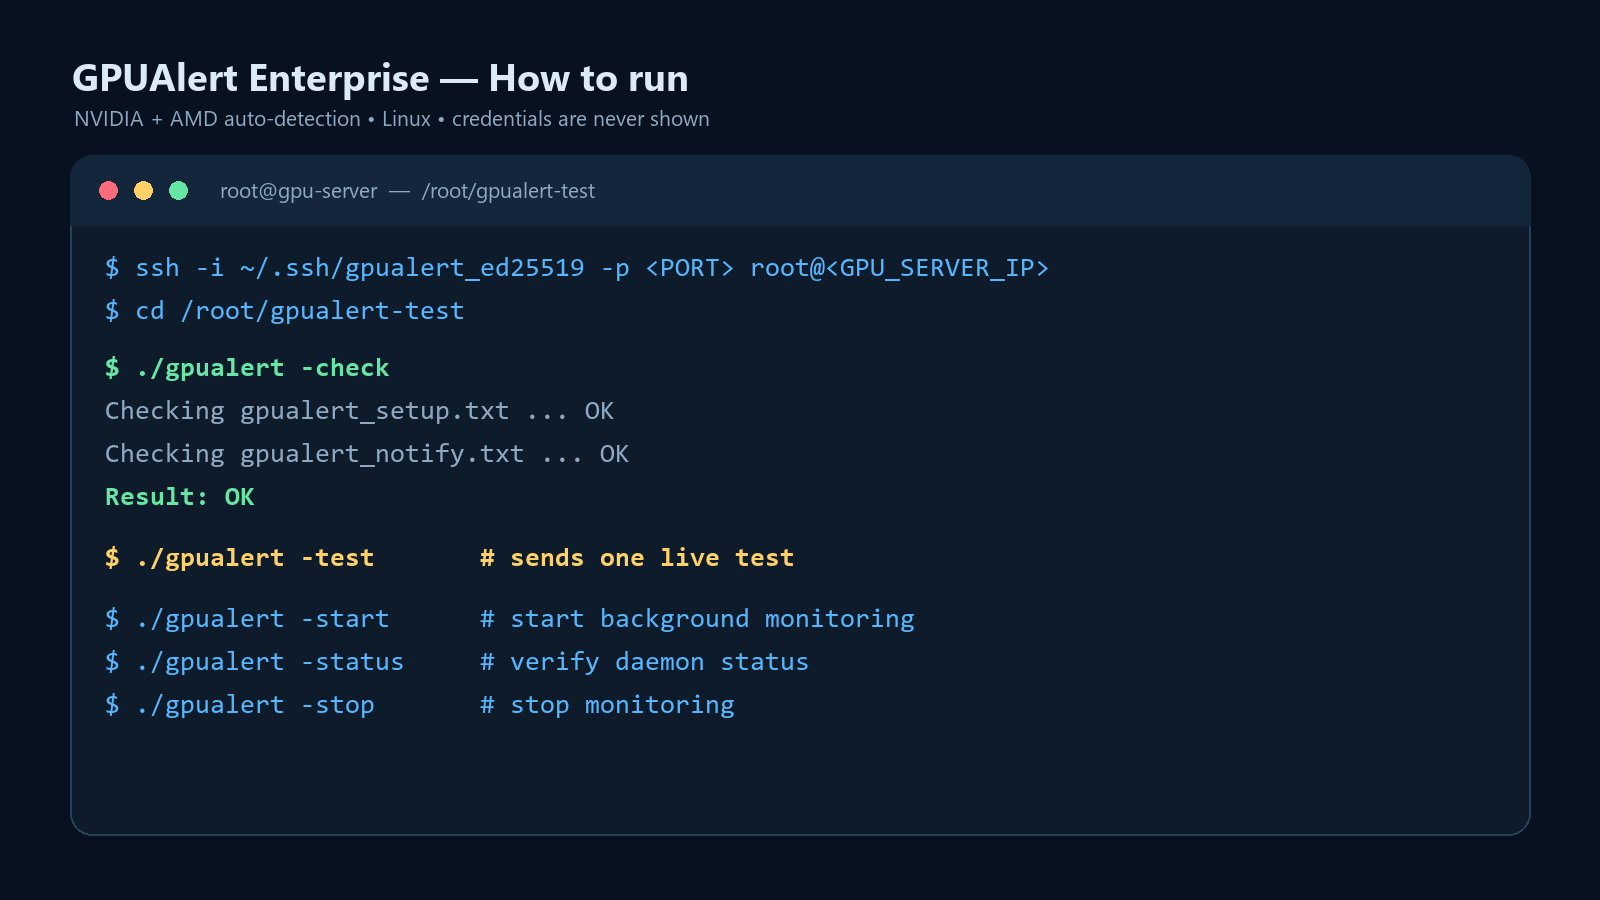
Build, check and start
make
./gpualert -check
./gpualert -probe
./gpualert -licenseinfo
./gpualert -test
./gpualert -start
./gpualert -status
Example VRAM alert configuration:
vramhighthreshold : "90"
vramhighnum : "3"
This sends an alert when any GPU remains at or above 90% VRAM usage for three consecutive checks, followed by a recovery when usage returns below the threshold. Prefix both settings with * to disable this monitor. The mem* settings monitor Linux host RAM.
Important:
./gpualert -test sends a real test through every configured channel and may create SMS charges.Trial mode
The trial sends the first notification for each alert incident. Repeated checks are suppressed while the condition remains abnormal; recovery closes and re-arms that incident, so a later occurrence starts counting from one. A normal reading before the configured consecutive count is reached resets the partial count to zero. (alert already sent) confirms delivery for the active incident, while (Trial Mode Limit Reached) identifies a Trial-policy block. Test notifications have a separate daily allowance and do not consume real monitoring alerts.
| Notification channel | Trial allowance |
|---|---|
| Email alert | 1 initial notice per active alert type + its recovery |
| Telegram | 1 initial notice per active alert type + its recovery |
| Teams or extended webhook | 1 initial notice per active alert type + its recovery |
| Smartbooth SMS | 1 initial notice per active alert type + its recovery |
Manual -test | 1 test per configured channel per calendar day |
| IamAlive email | 1 per calendar day |
Every Trial notification is clearly marked [TRIAL MODE]. A valid licensed mode removes both this header and the trial notification limits.
Node and annual Site licensing
License the server, not each GPU
Permanent Node
One physical Linux server, VM or cloud instance, including every supported GPU in that node.
Small Site
Up to 10 concurrently monitored nodes at one defined physical or cloud site.
Standard Site
Up to 50 concurrently monitored nodes. Larger 200-node and custom plans are available.
Node Licenses remain valid for the purchased major version. Site Licenses are annual and include updates and email support during the active term. Every license is Ed25519-signed; GPUAlert contains only the public verification key and the private signing key never leaves Smartbooth.
Host definition: one operating-system instance with one machine fingerprint. Moving to replacement hardware or rebuilding the VM requires a license reissue. The license does not cover subsidiaries, customer environments, resale, hosting for third parties or redistribution.
Local dashboard and Prometheus
Browser status
View a single host at http://127.0.0.1:9817/, retrieve JSON from /api/status, and review alert history from /api/history.
Existing monitoring stack
Prometheus can scrape /metrics. The included offline fleet console can aggregate reachable GPUAlert endpoints without a cloud service.
Frequently asked questions
Does GPUAlert require NVIDIA DCGM or AMD SMI?
No. NVIDIA telemetry uses the installed driver and nvidia-smi; AMD telemetry reads the Linux amdgpu sysfs interface. GPUAlert adds threshold logic, recovery, process context and direct notifications.
Does monitoring data leave the server?
No monitoring service is required. Only alerts you configure are sent to their selected destinations.
Does one license cover several GPUs?
Yes. One server license covers one licensed Linux host and every supported GPU installed in that host.
Is there an unlimited site license?
Public Site plans cover up to 10, 50 or 200 concurrently monitored nodes at one defined physical or cloud site. More than 200 nodes, multiple locations, multiple cloud regions and customer/MSP environments require a written Enterprise quote.
Must I renew after one year?
A Node License is perpetual for the purchased major version. A Site License expires after 12 months and must be renewed with a new signed license.dat. An expired Site license enters Trial mode until renewed.
Ready to monitor your GPU server?
Download the Linux trial, verify your notification channels, and choose an offline license when you are ready for unrestricted production alerts.
Download Trial License Pricing Back to Home